
- English
- 简体中文
- Español
- Português
- русский
- Français
- 日本語
- Deutsch
- tiếng Việt
- Italiano
- Nederlands
- ภาษาไทย
- Polski
- 한국어
- Svenska
- magyar
- Malay
- বাংলা ভাষার
- Dansk
- Suomi
- हिन्दी
- Pilipino
- Türkçe
- Gaeilge
- العربية
- Indonesia
- Norsk
- تمل
- český
- ελληνικά
- український
- Javanese
- فارسی
- தமிழ்
- తెలుగు
- नेपाली
- Burmese
- български
- ລາວ
- Latine
- Қазақша
- Euskal
- Azərbaycan
- Slovenský jazyk
- Македонски
- Lietuvos
- Eesti Keel
- Română
- Slovenski
- मराठी

Understanding Lab Values: The True Way to Read Color — Three Core Parameters for Color Difference Control in Engineering Plastics
“Is a ΔE of 2.1 on the colorimeter report acceptable or not?”
“The customer says the Lab values are off, but the colors look almost the same to me.”
These are questions our technical team hears every day. In the engineering plastics industry, color difference is no longer judged by the naked eye alone. Whether it’s automotive interior parts, 3C electronic housings, or industrial structural components, customers almost always include a Color Difference Acceptance Standard stating clearly: ΔE ≤ 0.5, with L, a, b values within specified tolerances.
So what exactly are L, a, and b? And why are they more reliable than visual inspection? Today, we’ll explain these three parameters in the language of engineering plastics production.
I. The “Coordinate System” of Color: The Lab Color Space
Imagine that to pinpoint a location on a map, you need longitude, latitude, and altitude. The Lab color space is the “three-dimensional coordinate system” for color.
Established by the International Commission on Illumination (CIE) in 1976, it remains the global gold standard for color measurement. Any color can be uniquely located in this three-dimensional space by a set of coordinates (L, a, b).
• L value (Lightness) : Ranges from 0 to 100. L=100 is pure white, L=0 is pure black. In engineering plastics, a black part appearing grayish or a white part turning yellowish is essentially a change in the L value.
• a value (Red-Green hue) : Positive values indicate red, negative values indicate green. When a flame-retardant ABS that should be bright red turns into a “dull brick red,” the a value is likely the issue.
• b value (Yellow-Blue hue) : Positive values indicate yellow, negative values indicate blue. The b value is the most “sensitive” parameter – materials like PBT, PC, and nylon are prone to yellowing during high-temperature processing. When the b value shifts positively, the part visibly “turns yellow.”
II. Three Numbers, Three Common “Color Difference Symptoms”
On the production floor, we quickly diagnose root causes through changes in Lab values:
1. Large deviation in L value – Prioritize checking material condition and molding process.
• High L value (too white/pale): Possibly low mold temperature or insufficient titanium dioxide in the color masterbatch.
• Low L value (too dark): Possibly material degradation (excessive high-temperature exposure) or poor mold venting.
2. Large deviation in a value – Prioritize checking the material formulation.
• Positive shift in a value (reddish): Common in flame-retardant materials, where the flame retardant decomposes at high temperatures, causing colorant discoloration.
3. Large deviation in b value – Prioritize checking drying conditions and injection temperature.
• Positive shift in b value (yellowish): The most common cause is overdrying or excessive melt temperature. Nylon materials are especially sensitive – a b-value drift of 0.5 is visibly “yellowish” to the naked eye.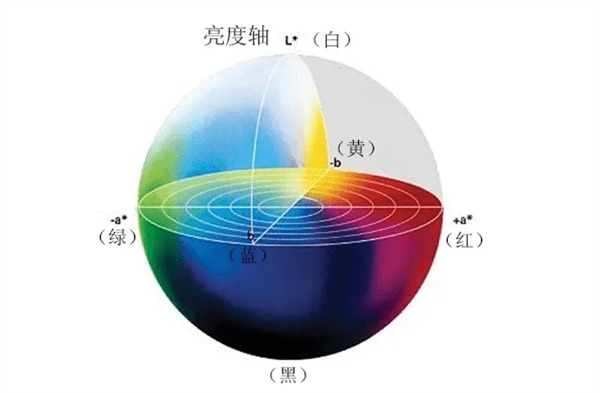
III. What is ΔE? Why Can’t We Rely on ΔE Alone?
ΔE is the combined deviation across the L, a, and b dimensions, calculated as:
ΔE = √[(ΔL)² + (Δa)² + (Δb)²]
It uses a single number to summarize “total color difference,” making quick judgment easy. However, the problem is: The same ΔE can represent very different color deviations.
For example:
• Case A: ΔL=1.0, Δa=0, Δb=0 → ΔE=1.0 (slightly too white)
• Case B: ΔL=0.6, Δa=0.6, Δb=0.6 → ΔE≈1.04 (deviations in all three directions)
Both have nearly the same ΔE, but Case B is more “complex” and may appear “muddier” to the naked eye. Therefore, professional color difference control must consider both ΔE and individual tolerances. A common standard for automotive interior parts is: ΔE < 1.0, with |ΔL| < 0.5, |Δa| < 0.5, |Δb| < 0.5.
IV. Where Does Color Difference Come From? Four Common Sources
Based on years of experience serving customers, the main sources of color difference fall into four categories:
1. Material batch variation – Different batches of engineering plastics may have slight differences in base color. Even for the same grade, a batch-to-batch b-value fluctuation of 0.3–0.5 for POM is not uncommon.
2. Drying process out of control – Materials like nylon, PET, and PC are sensitive to moisture. Under-drying or over-drying can cause yellowing. In one case, an operator increased the drying temperature from 80°C to 100°C, causing the b-value to jump from 1.2 to 2.8, scrapping an entire batch.
3. Injection molding process drift – Small changes in back pressure, screw speed, injection speed, holding pressure, mold temperature, etc., can alter melt flow and crystallization behavior, affecting color appearance. Glass-fiber reinforced materials are particularly sensitive.
4. Measurement environment differences – Different colorimeters, light sources, measurement apertures, or even the pressure applied by the operator can affect readings. Customers and suppliers must agree on a unified measurement standard (e.g., D65 illuminant, 10° observer angle).
V. Conclusion: Color Can Be Managed
In engineering plastics, color is no longer a mystery. The three numbers L, a, and b turn the subjective feeling “I think the color is wrong” into the objective fact “L value exceeds tolerance by 0.6, b value by 0.8.” Understanding the four sources of color difference helps us prevent problems before they occur.